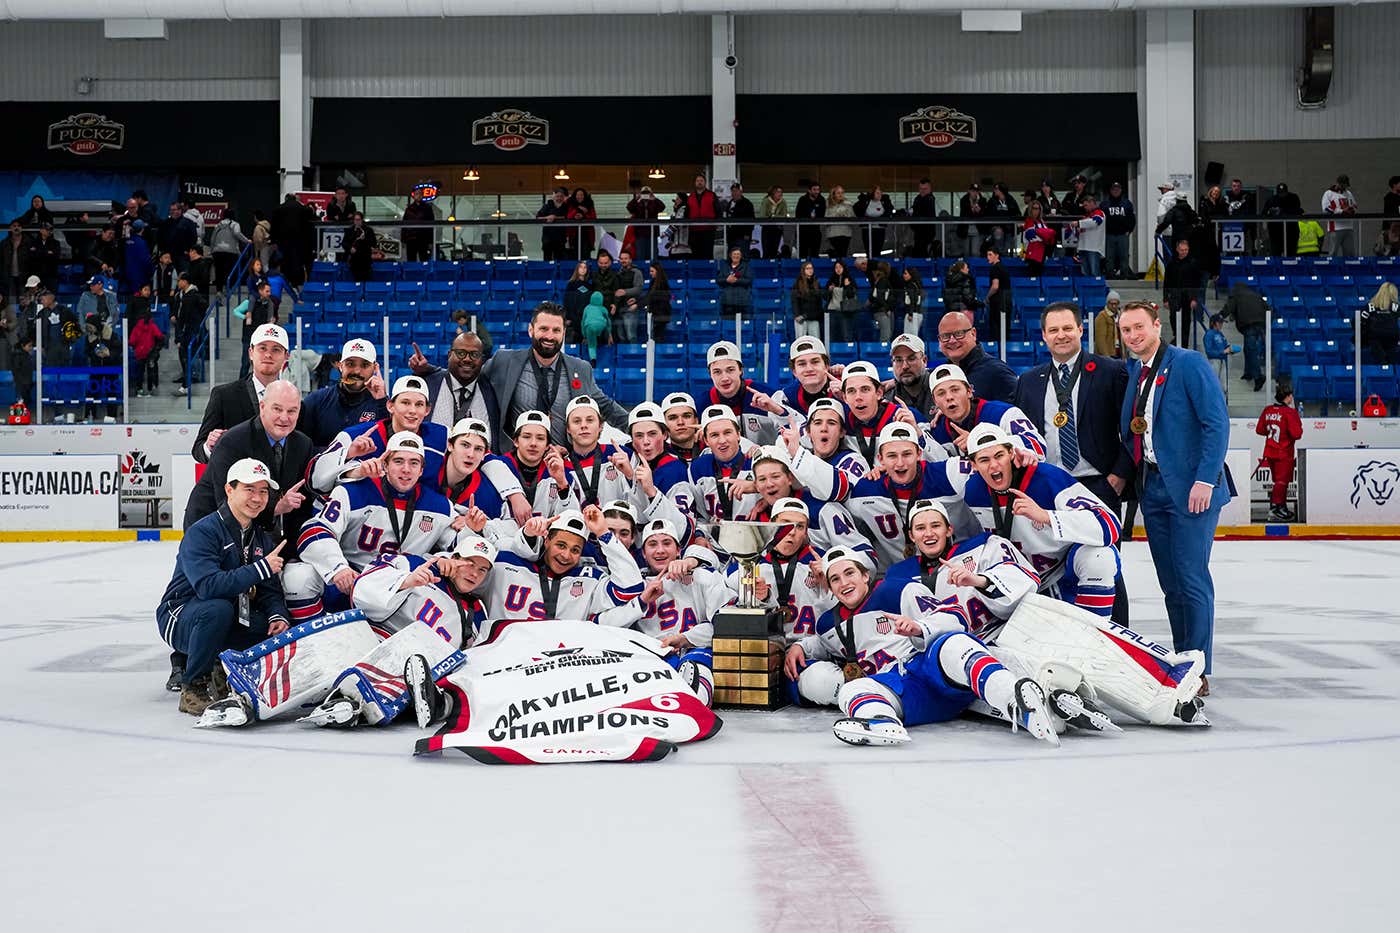
Last week, I had the pleasure of attending the 2026 U17 World Hockey Challenge in Oakville, Ontario. A special thank you to Rocco Zappia and Darren Boyce of the Puck Bunker (Puck Bunker — Hockey Scouting, Dug In) for helping me get access to the materials needed for this report. This is the beginning of a large-scale research project on Hockey Free For All. More prospect evaluations will be written, more tournaments like this one will be studied, and a pre-NHL-to-NHL AB pipeline will be built. Thank you all for reading!
1. Executive Summary
The United States won the 2026 U17 World Challenge, and AB Score saw it coming. Team USA finished the tournament with a team AB of +4.518, the highest of any roster by a margin of 1.5 points, and closed it with a 3 to 0 shutout of Czechia in the gold medal game. Across all six teams, the rank correlation between team AB and goal differential was +0.94. In plain terms, the metric ordered the field almost exactly the way the scoreboard did, without ever looking at goals for and against at the team level.
The individual story starts with Maddox Schultz. The Canada White center was the tournament’s best skater by a wide margin, and his +0.177 AB per game was 39 percent higher than the next skater. That score sits at the 100th percentile of every U17 forward we have scored from 2022 to 2026, a group that includes Gavin McKenna, Ivar Stenberg and James Hagens.
Team USA won on depth rather than stars. Eight Americans finished among the top 21 skaters, and all ten defensemen finished above zero, making the American blue line the event’s best unit. Czechia, meanwhile, won silver with only the fourth-best roster by AB (+1.302). The difference was goaltender Matyas Novotny, the tournament’s second-ranked goalie at +0.154 per game, who carried a team that was outshot in most of its games.
Canada Red outplayed Canada White over the full event (+3.004 to +2.613) and confirmed it with an 8 to 4 win in the bronze medal game, powered by the best power play in the tournament at 10 of 22. Finally, seven players earned a draft ‘Played Like a’ tier of Round 1 or better. That label is not a draft prediction, since most of these players are two drafts away. It means that at this tournament, they performed at the same level as past U17 players who went on to be drafted in that range. Three of them, Schultz, Brooks Suter, and Kash Kwajah, performed like past U17 players who became Top-10 picks.
The sections that follow cover the results, a team-by-team analysis, the individual rankings, player spotlights, the full methodology behind AB Score, and how HockeyFreeForAll.com will cover international tournaments going forward.
2. Tournament Results
Thirteen games were played over the preliminary round, quarterfinals, semifinals, and placement games. Goals listed are regulation and overtime only. Shootout goals are excluded from all goal and AB calculations.
| Round | Game | Score | Shots |
| Prelim | Czechia vs Canada White | CZE 6, CAN-W 4 | 42 to 37 |
| Prelim | Finland vs Canada Red | FIN 5, CAN-R 1 | 26 to 43 |
| Prelim | Sweden vs Czechia | 2 to 2, SWE won in SO | 25 to 33 |
| Prelim | Canada Red vs USA | CAN-R 6, USA 4 | 36 to 41 |
| Prelim | USA vs Finland | USA 13, FIN 1 | 50 to 21 |
| Prelim | Canada White vs Sweden | CAN-W 7, SWE 2 | 42 to 38 |
| Quarterfinal | Canada Red vs Sweden | CAN-R 6, SWE 1 | 38 to 31 |
| Quarterfinal | Canada White vs Finland | CAN-W 8, FIN 6 | 45 to 33 |
| Semifinal | Czechia vs Canada Red | CZE 4, CAN-R 3 | 29 to 39 |
| Semifinal | USA vs Canada White | USA 5, CAN-W 2 | 37 to 46 |
| 5th Place | Sweden vs Finland | SWE 8, FIN 5 | 33 to 22 |
| Bronze | Canada Red vs Canada White | CAN-R 8, CAN-W 4 | 53 to 40 |
| Gold | USA vs Czechia | USA 3, CZE 0 | 35 to 30 |
Final standings
| Place | Team | GF | GA | Diff | PP | PK | Team AB | AB Rank |
| 1 | United States | 25 | 9 | +16 | 3/14 | 77% | +4.518 | 1 |
| 2 | Czechia | 12 | 12 | 0 | 2/18 | 64% | +1.302 | 4 |
| 3 | Canada Red | 24 | 18 | +6 | 10/22 | 83% | +3.004 | 2 |
| 4 | Canada White | 25 | 27 | -2 | 7/29 | 73% | +2.613 | 3 |
| 5 | Sweden | 13 | 20 | -7 | 4/18 | 74% | +0.729 | 5 |
| 6 | Finland | 17 | 30 | -13 | 4/16 | 71% | +0.691 | 6 |
Every team in Group B (USA, Canada Red, Finland) went 1-1, showing how close the preliminary round was. Finland’s 5 to 1 upset of Canada Red came while being outshot 43 to 26, the kind of result a goal based ranking overreacts to and AB does not. By the end of the tournament, the order had settled, and AB’s ranking matched the final standings at five of six spots. The one exception, Czechia, is explained by goaltending (Section 3).
3. Team Analysis

Figure 1. Team AB rankings with goal differential and power play.
Team AB is the sum of every skater’s AB across the tournament. The Spearman rank correlation between team AB and goal differential was +0.94 (1.00 would be a perfect match). The tiers were clear: USA alone at the top, the two Canadian rosters together in the middle, and the three European teams below.
United States: Gold (+4.518)
USA had the most complete roster in the event. Their four best forwards, Carter Morris (+0.127), Joseph Cullen (+0.111), Maverick McKinnon (+0.092), and Dean Stevens (+0.090), all ranked in the top nine. The defining feature was the blue line: all ten defensemen finished as positive AB players, six of them at +0.068 or better, and Brooks Suter (+0.106) and Drew Daley (+0.085) made the All-AB teams. USA allowed nine goals in four games and only three after the opening loss to Canada Red. Mason Martin was the top-ranked qualified goalie (+0.236, .929 save percentage). The one weakness was the power play at 3 of 14.

Figure 2. United States roster AB card.
Czechia: Silver (+1.302)
Czechia is the most interesting result of the tournament. Their skaters ranked fourth by AB, and they were outshot in the semifinal (39 to 29) and the Gold Medal Game, but they still reached the final. Matyas Novotny (+0.154 per game, second among ranked goalies) was the reason. Up front, Dominik Zelezny (+0.086, 11th overall) was the only Czech skater in the top 25, and their power play converted only 2 of 18. AB suggests this Czechia team had a goaltending driven run, and the 3 to 0 gold game, where the skaters could not solve Martin, is consistent with that read.

Figure 3. Czechia roster AB card.
Canada Red: Bronze (+3.004)
Canada Red was the better of the two Canadian rosters and showed it in an 8 to 4 bronze medal win with a 53 to 40 shot edge. Kash Kwajah (+0.099) and Liam Pue (+0.089) led a forward group with ten players above zero, and Owen Loftus (+0.131) gave them stable goaltending. Canada Red’s power play went 10 for 22, the best in the tournament, and their penalty kill was also the best at 83 percent. Their two losses came against Finland and a one-goal semifinal against the eventual silver medalists.

Figure 4. Canada Red roster AB card.
Canada White: Fourth (+2.613)
Canada White had the event’s best player and a thin roster behind him. Maddox Schultz (+0.177), Madden Daneault (+0.100), Adrian Sgro (+0.105), Jace Voortman and Jacob McKinnon (both +0.074) carried the team, but five of twelve forwards finished below zero AB. They allowed 27 goals, the second most in the field, and their penalty kill (73 percent) and 7-for-29 on the power play held them back. The goaltending split was stark: Dylan Mingo at +0.016, Zachary Lainesse at -0.110.

Figure 5. Canada White roster AB card.
Sweden: Fifth (+0.729)
Sweden was a roster without a separating player. Isak Alvudd (+0.056) was the top Swede at 22nd overall, and four of their six defensemen finished below zero. Sweden beat Czechia in a shootout, and Finland 8 to 5 for fifth, and Otto Berggren (+0.013) gave them average goaltending.

Figure 6. Sweden roster AB card.
Finland: Sixth (+0.691)
Finland beat Canada Red in the opener and then allowed 25 goals in their final three games. Joose Lahtinen (+0.044) led the team, but goaltending was the main problem: Sami Sinkko (-0.105) and Onni Tennberg (-0.329, the lowest-ranked goalie) combined to allow 30 goals in five games.

Figure 7. Finland roster AB card.
4. Individual Rankings

Figure 8. Top 10 skaters by AB per game.
The top ten included five Americans, three players from Canada White and two from Canada Red. No European skater made it, with Czechia’s Dominik Zelezny the closest at 11th. Schultz’s lead over second place (+0.050) is larger than the entire gap between second and tenth, which shows how far ahead of the field he played.
All-Tournament AB Teams

Figure 9. First and second All-Tournament AB teams.
The All-Tournament AB teams take the top three forwards, two defensemen, and one goalie by AB per game, using the same two-game minimum as the full rankings. The first team is built around Schultz, with Americans Carter Morris and Joseph Cullen beside him, Brooks Suter and Adrian Sgro on defense, and Mason Martin in goal. The second team features Madden Daneault, Kash Kwajah and Maverick McKinnon up front, an all-American pair of Drew Daley and Ryan Teuscher on defense, and Matyas Novotny in net.
Seven of the twelve spots went to the United States, which matches their team result. Novotny is the only European player on either team, a fitting reflection of how much of Czechia’s silver medal ran through its crease.
Complete Skater Ranking
All 122 skaters are ranked below by AB per game. A player needed at least two games to be ranked, so a single great or poor game cannot decide anyone’s place, and every skater in this tournament met that bar.

Figure 10. Skater AB ranking, 1 to 45.

Figure 11. Skater AB ranking, 46 to 90.

Figure 12. Skater AB ranking, 91 to 122.
About 70 percent of skaters (86 of 122) finished above zero. Swedish and Finnish skaters fill most of the bottom thirty places, which lines up with their team results.
Complete Goalie Ranking

Figure 13. Goalie AB ranking. Goalies with one game are listed below the line as not qualified.
Eight goalies qualified. The top three, Martin, Novotny, and Owen Loftus, played for the three medal winners, which says a great deal about what decided this tournament. The gap between third (+0.131) and fourth (+0.016) is the largest anywhere in the ranking. Colby Arnold’s single start (+0.293) was the best individual goalie game of the event, but one game isn’t enough to rank him, so he’s listed below the line for reference.
5. Player Spotlights
Each spotlight card places the player against every U17 skater or goalie we have scored from 2022 to 2026. The right side lists his closest historical comparable, the notable first-round picks he outscored, and a ‘Played Like a’ tier showing where past U17 players who performed at his level at this event were eventually drafted. It describes how he played here, not where he will be picked, since most of these players are still one or two drafts away. Section 6 explains how these are built.
Maddox Schultz, Canada White, Center, 2028 Draft
Schultz led the tournament in AB (+0.177), points (17 in 5 games, 6 goals and 11 assists), and was the only forward at the 100th percentile in all three of his comparison groups. His closest historical comparable is James Hagens (2022 U17), and he outscored 30 of the 31 first-round forwards in our U17 sample, including Gavin McKenna and Ivar Stenberg at the same event. He played 23 minutes a night, sitting alone at the top right of the scatter. At this tournament, he played like past U17 players who became Top 10 picks.

Figure. Maddox Schultz spotlight card.
Brooks Suter, United States, Defense, 2029 Draft
Suter is one of the youngest players in the event (born November 2010, 2029 draft) and was the best defenseman in it. He was +9 in four games with 5 points and outscored all 11 first-round defensemen in our U17 sample, including Matthew Schaefer and Zayne Parekh. His closest comparable is Charlie Trethewey. At this tournament, he played like past U17 players who became Top 10 picks, and he is still more than two years from his draft.

Figure. Brooks Suter spotlight card.
Kash Kwajah, Canada Red, Forward, 2028 Draft
Kwajah led Canada Red with 5 goals and +0.099, ranking 100th percentile on his own team and 95th among all U17 forwards. He outscored 26 of 31 past first-round forwards, including McKenna, Anton Frondell and Tij Iginla. His tournament matched the level of past U17 players who went on to become Top 10 picks.

Figure. Kash Kwajah spotlight card.
Liam Pue, Canada Red, Forward, 2028 Draft
Pue (6-foot-2, 10 points, 34 shots) gave Canada Red a second top-ten skater. His 91st-percentile score puts him alongside past first-round forwards. He played like past U17 players who went on to be Round 1 picks.

Figure. Liam Pue spotlight card.
Dominik Zelezny, Czechia, Center/Wing, 2029 Draft
Zelezny is a 2029-eligible player who played 22 minutes a night for a silver medal team and finished 11th overall. He outscored 25 of 31 past first-round forwards and his closest comparable is Shane Vansaghi. At this event, he performed like past U17 players who were later drafted in Round 1.

Figure. Dominik Zelezny spotlight card.
Isak Alvudd, Sweden, Forward, 2028 Draft
Alvudd was Sweden’s best skater (+0.056, 3 goals, 5 points) and ranked 100th percentile on his team. At the 82nd percentile league-wide, his tournament resembled past U17 players who went in Round 1, though only 9 percent of similar players actually did, so the signal is weak. He is the European forward to track.

Figure. Isak Alvudd spotlight card.
6. Methodology: The Scientific Process Behind Tournament AB Score
AB Score was built to answer one question: how much did a player actually help his team win, beyond what the box score shows? This section explains how the U17 World Challenge study was built: the data behind it, the sheets that organize it, how we compare players with past classes, and how we tested whether the results
Junior evaluation still leans heavily on points, which reward players on strong teams and miss most of what happens away from the scoresheet. My hypothesis was that a single per-game value capturing a player’s full impact on winning would do two things. First, it would rank teams in line with their actual results. Second, it would identify prospects whose performance tracks with where past players at the same level were drafted. This tournament tested both.
Player event data came from InStat game exports for all 13 games. Team data came from official Hockey Canada game summaries, which list goals, shots, power-play goals, and opportunities for each side.
Before scoring any player, I checked each game’s team totals against the official summary. I removed shootout goals, so a skills competition cannot change a player’s value. I then processed every U17 World Challenge from 2022 to 2025 the same way and matched each player to his NHL draft result. That created a historical comparison set of several hundred skaters and 26 goalies with known outcomes.
The study is organized into sheets that build on one another. The foundation is one skater sheet and one goalie sheet for each U17 World Challenge from 2022 through 2026, each holding every player’s tournament data as verified in 6.2.
From those, I built a comparison pool for each past tournament. Each player in a pool has his AB per game, his percentile at his position, the number of games on file, and his draft outcome: round, overall pick, or undrafted. A separate goalie pool does the same for every U17 goalie since 2022.
The 2026 sheet sits on top of all of it. Every current player scores the same way and is measured against the full history, so each new class is automatically compared with the ones that came before it. Every graphic in this report comes directly from these sheets.
Skaters and goalies are scored with separate proprietary formulas, AB for skaters and BractoG for goalies. Both measure a player’s contribution to winning in context, so two players with identical box scores could earn different values if they produced them in different situations. Both are calibrated against team results and expressed on the same per-game scale, so you can read skaters and goalies side by side. The specific inputs and weights are proprietary and are not shown on public graphics.
A player must appear in at least two games to be ranked or named to an All-Tournament AB team. Early versions of this work ranked every player, which allowed a goalie with one strong start to finish ahead of goalies who played three or four games. One game is too small a sample to support that conclusion, so single-game players are now listed below the rankings as not qualified, for reference only. Spotlight cards also carry a limited sample note whenever a tier rests on five or fewer games.
Each player is placed in three percentile groups: this tournament, his position across every U17 event from 2022 to 2026, and his own team. The dashed line on each team card is replacement level: the average AB per game at that position across every U17 player since 2022, which works out to +0.026 for forwards, +0.017 for defensemen, and roughly zero for goalies. A player to the right of that line outperformed a typical U17 player in his position.
The closest comparable on each spotlight card is the past player at the same position with the nearest percentile, with at least three games on file; a player is never compared with himself. The ‘had a better score than’ panel lists the highest drafted players at his position who finished below him in percentile.Top 10 picks are rare in any group of players. If we only asked what share of similar tournament players became a Top 10 pick, the answer would almost always be small, even for the best players in the field. So instead we ask how much more often past tournament players at his level reached each tier than the average tournament player did.
Instead, every past skater with at least three games on file is weighted by how close his percentile is to the player in question, using a smooth bell curve so that players within about three percentile points count the most. For each draft tier (Top 10, Round 1, Rounds 2 and 3, Rounds 4 to 7, and undrafted) we calculate the weighted share of those similar players who landed there, then compare that share with how often the tier occurs across the entire U17 pool. That ratio is the lift. The tier shown is the highest one that similar players reached at least twice as often as average, provided at least 20 percent of them actually reached it.
On Schultz’s card, ‘23 percent of similar past players went top 10, 3.8x the U17 average’ means players at his level were nearly four times as likely as a typical U17 player to become a top ten pick. It is a statement about how he performed compared with players who came before him, not a prediction of where he will be drafted. Most of these players are two drafts away, and a great deal of development, both theirs and their peers’, will happen before then.
At the team level, the Spearman rank correlation between team AB and goal differential was +0.94 across the six teams, and AB’s order matched the final standings for five of six teams. The one miss, Czechia, is explained by a goalie whose value appears in the goalie ranking rather than the skater total. Historically, the same pipeline applied to 2022 through 2025 places future first-round picks such as McKenna, Hagens, Schaefer, Frondell and Desnoyers in the top quarter of their position, which is what gives the ‘Played Like a’ tiers their meaning. Throughout, every scored game was reconciled with the official summary, and any player without a full set of games on file is flagged rather than estimated quietly.
7. Tournament Coverage Going Forward
This report is the first product of a repeatable system. Two notebook pipelines now generate every graphic in this report from raw data in minutes, which means Hockey Free For All can cover international events as they happen rather than weeks afterward.
The U17 notebook takes the InStat skater and goalie exports and the game results from Hockey Canada’s summaries, and from those produces the tournament leaders, team AB rankings, a roster card for every team, spotlight cards for each team’s top skater and goalie, the All Tournament AB teams, and complete skater and goalie rankings. During an event, new games are added after each day, and every card regenerates with an updated stage label, so the coverage stays current from the opening game to the final. Because every U17 since 2022 is already scored, each new class is automatically measured against the ones before it.
The World Juniors notebook runs on the same engine, adapted for the WJC, and covers the 2020, 2021, 2023, 2024, 2025 and 2026 tournaments. A single-year setting switches the entire notebook to any of those events, with its own logos and output folder. Because many WJC players are already drafted, their cards show their actual NHL draft position next to their tournament score, letting us measure how well drafted players lived up to their selection. Each player’s scatter plot shows every World Juniors he has played, so his progress across tournaments is visible on one card. The 2027 World Juniors will be covered live from opening day using this notebook.
Many players in this U17 field will play at the World Juniors in two or three years. Because both notebooks use the same formula and scale, we can follow a player from U17 to WJC and test whether early AB predicts later performance. Over time, this becomes a long-term study of Canadian and international prospects, and a direct check on how well the metric projects development.
During each event, leaders and standout cards will be posted to @hockeyfree4all, with full team cards and rankings released at the end of the round robin and again at the end of the tournament. After each event, a complete report like this one will be published on hockeyfreeforall.com and shared directly with industry contacts.
8. Limitations and Next Steps
Five games is a small sample, so the percentiles and ‘Played Like a’ tiers in this report should be read as strong signals rather than final grades. Past U17 years also depend on which games InStat charted; in some years, that was as few as one game per player, and those players are excluded from comparables when they have fewer than three games on file. AB is not yet adjusted for differences in competition strength from one year to the next, and with only 26 past goalies in the historical pool, goalie tiers carry wider uncertainty than skater tiers.
Next, I plan to add zone entry and exit data where available, build a strength-of-schedule adjustment, and begin the U17-to-World Juniors follow-up study.
9. Conclusion
Short international tournaments are where many first impressions of a prospect are formed, and where those impressions are hardest to trust. A player gets five games, a few shifts on the power play, and maybe one bounce that decides how he is remembered. The goal of this work is not to replace the scouts, coaches, and staff who watch these players in person. It is to give them a second, independent read that holds every player to the same standard and puts each performance next to the history that came before it.
What makes that possible isn’t any single tournament, but the record being built across them. Every U17 World Challenge and World Junior Championship added to these sheets sharpens the comparisons, deepens the samples, and makes the conclusions more reliable. A player evaluated today becomes part of the measuring stick for the players who follow him, and his path from this event to the draft, to junior and college hockey, and eventually to the World Juniors becomes evidence we can test the method against.
That is the standard I intend to hold this work to. The findings in this report will be revisited as these players develop, and where the method gets something wrong, that will be reported as openly as what gets right. The aim is a tool that earns trust over time by being transparent about its results, consistent in its application, and honest about what a handful of games can and cannot tell us.
I welcome feedback from anyone who reads this report, and I look forward to continuing this work at the 2027 World Junior Championship.
Bracton Abella
hockeyfreeforall.com | @hockeyfree4all
Leave a Reply